You’re showing up everywhere: LinkedIn, Instagram, TikTok, YouTube.
But the second someone asks, “Hey, what’s actually working?” you freeze.
Panic.
Twenty browser tabs.
A spaghetti bowl of spreadsheets.
Sounds familiar?
Tracking your content shouldn’t feel like a part-time data analyst gig. But for most content marketers, founders, or agency teams, that’s exactly what it is — unless you rethink the system.
Let’s break down why cross-platform analytics feels so broken right now — and how to fix it with tools built for the modern content stack.
Let’s be brutally honest.
Traditional content tracking is broken.
Because every platform plays by its own rules — and its own metrics.
It’s a Tower of Babel for marketers.
Different formats. Different goals. Different numbers.
So what happens? You end up trying to stitch all this chaos together by hand
By the time you finish all that?
Data delayed is data denied.
And it’s not just about the time you waste.
It’s about what you’re not measuring.
Most teams stop at vanity metrics — likes, comments, views — because they’re easy to screenshot and easy to explain.
But the truth is
The real metrics such as traffic generated, leads collected, deals closed, content reused — get buried in the spreadsheet shuffle.
And that’s when teams fall back on gut feelings:
But, feelings are not a strategy.
If you’re running a lean team or juggling multiple clients, you can’t afford to base decisions on your gut. You need performance-led reuse of what actually drives results, not what simply looks good.
But with traditional tracking, you never get there.
That’s why spreadsheets and platform-native dashboards fail you — they’re designed for reporting, not for making smarter, faster decisions.
OK, let’s be real. You don’t want to live in spreadsheets. You want to know
“Is my content working?”
But what does working even mean?
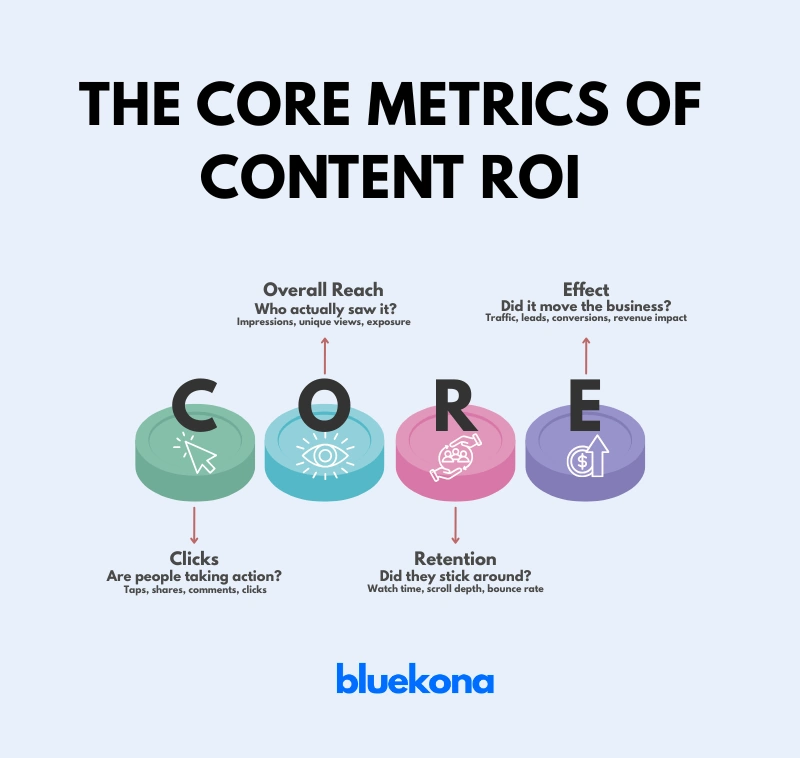
Let’s ditch the fluff metrics and look at what actually matters. Here’s a simple, memorable framework you can steal right now — I call it the CORE Metrics of Content ROI
First, you need to know if your content moves people.
If no one is interacting, the rest of the funnel doesn’t matter. Think of clicks and engagement as your first proof of life.
Next, look at how many people even saw your content in the first place.
This tells you if your distribution is working. Because no matter how amazing your video is, if only 14 people see it, you can’t scale its impact.
Pro tip: Combine reach with engagement to find your engagement rate — a stronger indicator of how well your creative resonates.
Retention is the forgotten hero of content analytics.
Yes, it’s awesome if people see your video. But do they finish it?
Or do they bounce after two seconds?
Retention shows you
For video, measure average watch time or % viewed.
For blogs, measure time on page or scroll depth.
Retention is the difference between a scroller and a future customer.
Finally, measure the effect.
This is where many teams fail — they post once, look at the likes, and move on.Smart content teams reuse high-performing assets across other platforms or formats.
But realistically, you’re too busy jumping between channels, copying data, and fighting spreadsheets.
That’s why a modern tracking tool should do this heavy lifting for you.
So you can stop guessing — and start scaling.
Okay. Let’s imagine for a second that you weren’t stuck in spreadsheet hell.
Instead, you had a dream setup built perfectly for a modern content team.
Here’s what that would look like.
First off, picture one single dashboard pulling in:
No more bouncing between tabs, exporting CSVs, or wasting hours merging data.
A unified view means you instantly spot patterns across all your channels.
Because let’s be honest — your audience doesn’t live on just one platform. Neither should your reporting.
The second piece of the dream: fresh, live data.
Real-time updates mean you’re not making decisions on week-old metrics.
Real-time signals let you pivot fast.
If a LinkedIn carousel is going viral, you want to double-down immediately. If your YouTube Shorts are tanking, you can pause and rethink before investing more.
In a content world that moves at the speed of memes, stale data is worthless.
You shouldn’t have to become a data scientist to spot patterns.
A dream dashboard would give you visual cues — at a glance
Think of it like traffic lights for your content.
Instead of digging through 45 rows of numbers, you’d have a clear, visual answer
This is what to keep. This is what to kill.
Finally — the best setup doesn’t just dump data on your lap.
It tells you what to do with it.
You want decisions, not data paralysis.
Because here’s the truth:
Data is only powerful if it changes your behavior.
The dream setup takes away all the busywork of aggregating, cleaning, and guessing — and gives you the confidence to act today.
Of course, most teams can’t build this from scratch. You’d need:
And that’s exactly why Bluekona AI steps in — to give you this dream system without the nightmare build-out.
Here’s where tools like Bluekona AI flip the old process on its head.
Instead of manual tracking, you get
In other words, Bluekona AI takes your messy content data soup and turns it into a clear, actionable strategy.
It’s like having a strategist + analyst living inside your content engine — powered by AI.
Here’s how it might look in practice:
Plug in your LinkedIn, TikTok, YouTube, Instagram, and beyond.
Bluekona pulls your metrics and maps them to a consistent framework (the CORE Metrics)
Instead of combing through a spreadsheet, you’ll get instant suggestions:
Your time goes into strategy, not spreadsheet busywork.
Let’s face it. If you can’t measure, you can’t scale.
It’s not enough to know what feels good on social media. You need to know — with clarity and confidence — what’s actually driving business results.
But you shouldn’t have to turn yourself (or your team) into a data scientist just to answer these questions.
Bluekona AI takes the grunt work off your plate, automatically handling. From pulling the data to tagging and organizing your content, from analyzing performance across every channel to recommending your next best move.
With Bluekona, you track less, but you learn more — because insights are delivered to you, ready for action.
Let Bluekona do the tracking. You make the calls.
Jun 12, 2026Anjana Devi
Most brands do not actually have a content problem. What they have is a mismatch problem. The same post goes out on LinkedIn, Instagram, TikTok, Facebook and YouTube, all on the same day, all looking the same. Then everyone sits around wondering why one platform brings results and the rest bring silence. Here is the […]